

Debugging is a crucial aspect of developing robust and efficient applications. For Laravel developers, the Laravel Debugbar offers a comprehensive solution to monitor and optimize application performance. This package integrates seamlessly into Laravel projects, providing real-time insights into various aspects of the application.
What is Laravel Debugbar?
Laravel Debugbar is a package that integrates the PHP Debug Bar into Laravel applications. It provides developers with a developer toolbar for debugging and profiling Laravel applications, offering insights into queries, routes, views, and more.
Key Features
- Performance Monitoring: Track execution time and memory usage to identify bottlenecks.
- Query Analysis: Inspect database queries, including execution times and parameters.
- View Rendering: Monitor views being rendered and the data passed to them.
- Route Information: Access details about the current route, including the controller and middleware.
- Exception Handling: Log and display exceptions for easier debugging.
Installation and Setup
To install Laravel Debugbar, run:
composer require barryvdh/laravel-debugbar --devThis command adds the Debugbar to your development dependencies, ensuring it’s not included in production builds.
Configuration
After installation, the Debugbar is enabled by default when APP_DEBUG is set to true in your .env file. You can publish the configuration file using:
php artisan vendor:publish --provider="Barryvdh\Debugbar\ServiceProvider"This allows you to customize settings such as enabling/disabling specific collectors and controlling the inclusion of vendor assets.
Using Laravel Debugbar
Once installed and configured, the Debugbar appears in your application when accessed through a web browser. It provides a toolbar with various tabs, each offering different insights:
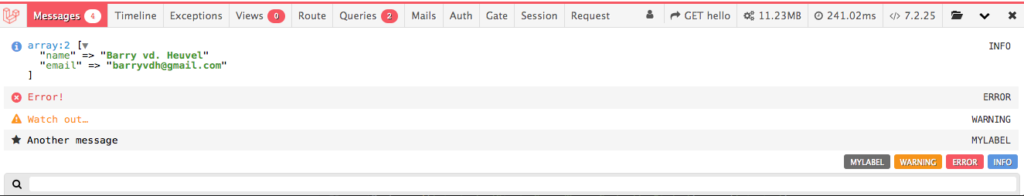
- Messages: Log custom messages using the
Debugbarfacade. - Timeline: Visualize the time taken by different parts of your application.
- Exceptions: View details of any exceptions thrown during execution.
- Views: See which views were rendered and the data they received.
- Route: Get information about the current route, including parameters and middleware.
- Queries: Inspect all database queries executed for the request.
Advanced Features
Beyond basic monitoring, Laravel Debugbar offers advanced functionalities:
Custom Timing
Measure the execution time of specific code blocks using:
Debugbar::startMeasure('render','Time for rendering');
// Code to measure
Debugbar::stopMeasure('render');
Custom Messages
Log custom messages to the Debugbar:
Debugbar::info($variable);
Debugbar::warning('Watch out…');
Debugbar::error('Error!');
Best Practices
- Development Only: Ensure the Debugbar is disabled in production environments to prevent performance issues and potential information leaks.
- Selective Enabling: Enable only the necessary collectors to reduce overhead.
- Regular Monitoring: Use the Debugbar regularly during development to catch and address issues early.
Conclusion
Laravel Debugbar is an invaluable tool for developers aiming to optimize their applications. By providing real-time insights into various aspects of the application, it facilitates efficient debugging and performance tuning. Integrating Laravel Debugbar into your development workflow can lead to more efficient and maintainable applications.
Comments